

Dec 12, 2025
Tips For Conducting Studie
Data Analysis
Data Visualization
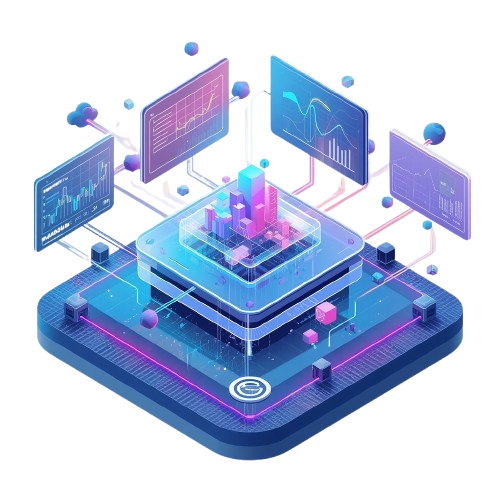
We specialize in turning raw and complex data into intuitive visual stories. Our data visualization solutions help businesses identify trends, monitor performance, and communicate insights clearly across teams and stakeholders.
Whether it’s executive dashboards, real-time monitoring views, or advanced analytical charts, we design visuals that simplify complexity and highlight what truly matters: your data’s story.
WHAT WE DELIVER
-
01Interactive Dashboards
We create dynamic dashboards that allow users to explore data in real time, filter information, and gain instant insights into key performance metrics.
-
02KPI Visualization
We design clear and focused KPI dashboards that highlight critical business metrics, helping teams track performance and progress at a glance.
-
03Advanced Data Charts
We build a wide range of visualizations including bar charts, line graphs, pie charts, and scatter plots to represent data trends and relationships effectively.
-
04Real-Time Data Visualization
We implement live dashboards that update in real time, enabling businesses to monitor operations, systems, and performance as they happen.

Eve Mmadueke
Head of Business Development
Start a conversation with our data visualization experts
Connect with our team to build custom data visualization solutions tailored to your business goals and reporting needs.
OUR DATA VISUALIZATION PROCESS
01
Discovery & Requirement Gathering
We begin by understanding your business goals, key metrics, data sources, and reporting challenges. This helps us define what needs to be visualized and how insights will be used.
02
Data Assessment & Structuring
We evaluate your datasets to ensure they are clean, consistent, and properly structured for visualization. This includes identifying relationships, patterns, and key performance indicators.
03
Visualization Planning & Design
We design the layout, chart types, and dashboard structure based on your objectives. Each visual is carefully planned to ensure clarity, usability, and meaningful insight delivery.
04
Dashboard & Visualization Development
We build interactive dashboards and data visuals using modern tools and frameworks, ensuring users can explore, filter, and interact with data easily.
05
Testing & Validation
We verify that all visuals are accurate, responsive, and aligned with your data sources. This ensures consistency, reliability, and performance across all dashboards.
06
Deployment & Integration
We deploy your visualization solutions into your preferred environment and integrate them into existing systems, applications, or reporting platforms.
07
User Training & Enablement
We guide your team on how to use dashboards, interpret visuals, and interact with data effectively to maximize the value of the solution.
08
Continuous Improvement & Optimization
We continuously refine and enhance your visualizations based on feedback, new data sources, and evolving business needs to ensure long-term value.
TECHNOLOGIES WE USE
Data Visualization Tools
Tableau
Microsoft Power BI
Looker
Data Processing & Preparation
Python
SQL
dbt (Data Build Tool)
Backend & API Integration
REST APIs
GraphQL
Node.js
FREQUENTLY ASKED QUESTIONS
What is data visualization?
Data visualization is the process of turning raw data into graphical representations like charts, graphs, and dashboards to make information easier to understand and interpret.
What types of data visualizations do you create?
We create interactive dashboards, KPI dashboards, bar charts, line graphs, pie charts, scatter plots, and custom visual analytics tailored to your business needs.
Can you integrate multiple data sources into one dashboard?
Yes. We integrate data from databases, APIs, CRMs, ERPs, cloud platforms, and third-party tools to create a unified and centralized dashboard experience.
What tools do you use for data visualization?
We use tools like Tableau, Power BI, Looker, Qlik Sense, Metabase, and custom visualization libraries such as D3.js and Chart.js depending on project requirements.
Can I get real-time dashboards?
Yes. We can build real-time dashboards that update automatically as your data changes, giving you instant visibility into your key metrics.
Do you customize dashboards for different users?
Absolutely. We design role-based dashboards so executives, managers, and analysts each see the most relevant insights for their needs.
Will my team receive training on how to use the dashboards?
Yes. We provide guidance and training to ensure your team can confidently navigate, interpret, and use the dashboards effectively.
Can your visualization solutions scale with my business?
Yes. Our solutions are built to scale, allowing you to add new data sources, metrics, and users as your business grows without performance issues.